Efficacy
How Mathua measures learning — and the honest limits of what the numbers can claim.
What is recorded
Every answer writes one attempts row: student, concept, correctness, elapsed seconds, timestamp. Nothing is sampled or aggregated at write time — every metric below is computed from the raw log.
Point-in-time figure
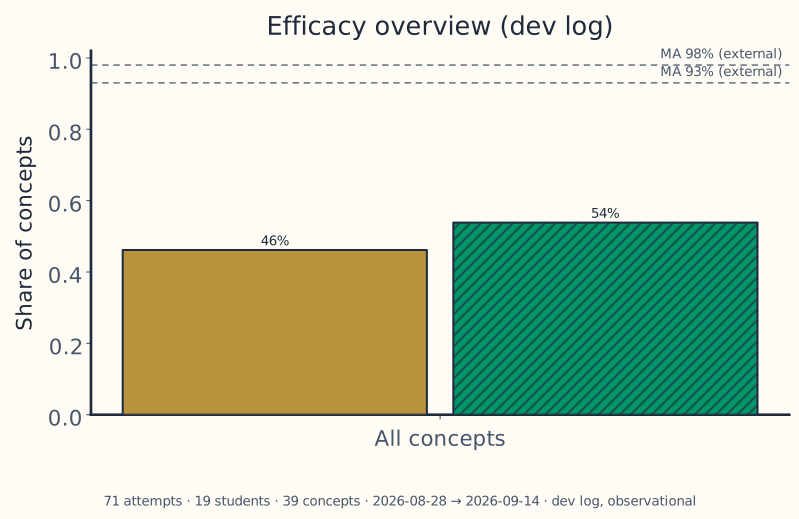
Generated from the dev attempt log by python3 figures/efficacy.py (style adapter: figures/mathua_style.py). The MA 93%/98% lines are external reference markers, not Mathua data. The weekly-trend panel is deliberately omitted: with 70 + 1 attempts across two week-buckets a trend line would mislead. Regenerate after real usage accumulates:
python3 figures/fetch_fonts.py   # once per machine (gitignored display fonts)
python3 figures/efficacy.py      # dump mathua.db -> figures/efficacy_data.json + render
# then copy figures/output/efficacy-overview.svg to web/next-app/public/figures/
Longitudinal metrics
GET /api/efficacy/trend returns weekly Monday–Sunday buckets with per-week pass rates, plus a coarse retention signal (students active in two or more distinct weeks ÷ all students who ever attempted) and the first-pass trend (last week minus first week). The Profile page renders the last 12 weeks as a first-pass sparkline plus the retention figure.
How to read it
- Compare within a student, not across. A learner's own weekly first-pass rate is a more honest signal than the product-wide number, which mixes learners at very different frontiers.
- Watch active_students before the rate. A week with three attempts can show 0% or 100% by accident.
- Second-pass is the recovery metric. A gap between first- and second-pass rates means material is learnable with feedback but not yet automatic.
Limitations
- No control group and no randomisation: these are usage metrics, not an efficacy claim. Mathua does not assert the 4× / 93% / 98% figures from Math Academy’s marketing.
- Retention is binary (returned / did not) over the whole window; it does not model decay or churn timing.
- Buckets are UTC weeks; a learner near a timezone boundary can appear in two weeks for one study session.
- The attempt log is the source of truth. If it is cleared, all metrics reset.
Reproducing an analysis
# product-wide point-in-time
curl -s localhost:8080/api/efficacy/all | jq
# weekly trend + retention
curl -s localhost:8080/api/efficacy/trend | jq
Both read only the local database; no external service or API key is involved. Full definitions live in docs/efficacy.md.